A total eclipse, computed rather than illustrated
A total solar eclipse crossed Europe on 12 August 2026. I worked out what it looked like from Paris, Palma de Mallorca and Reykjavík, and wrote a simulator to draw it.
Labels skyfield JPL DE440s ephemeris 12 August 2026 three places no dependencies
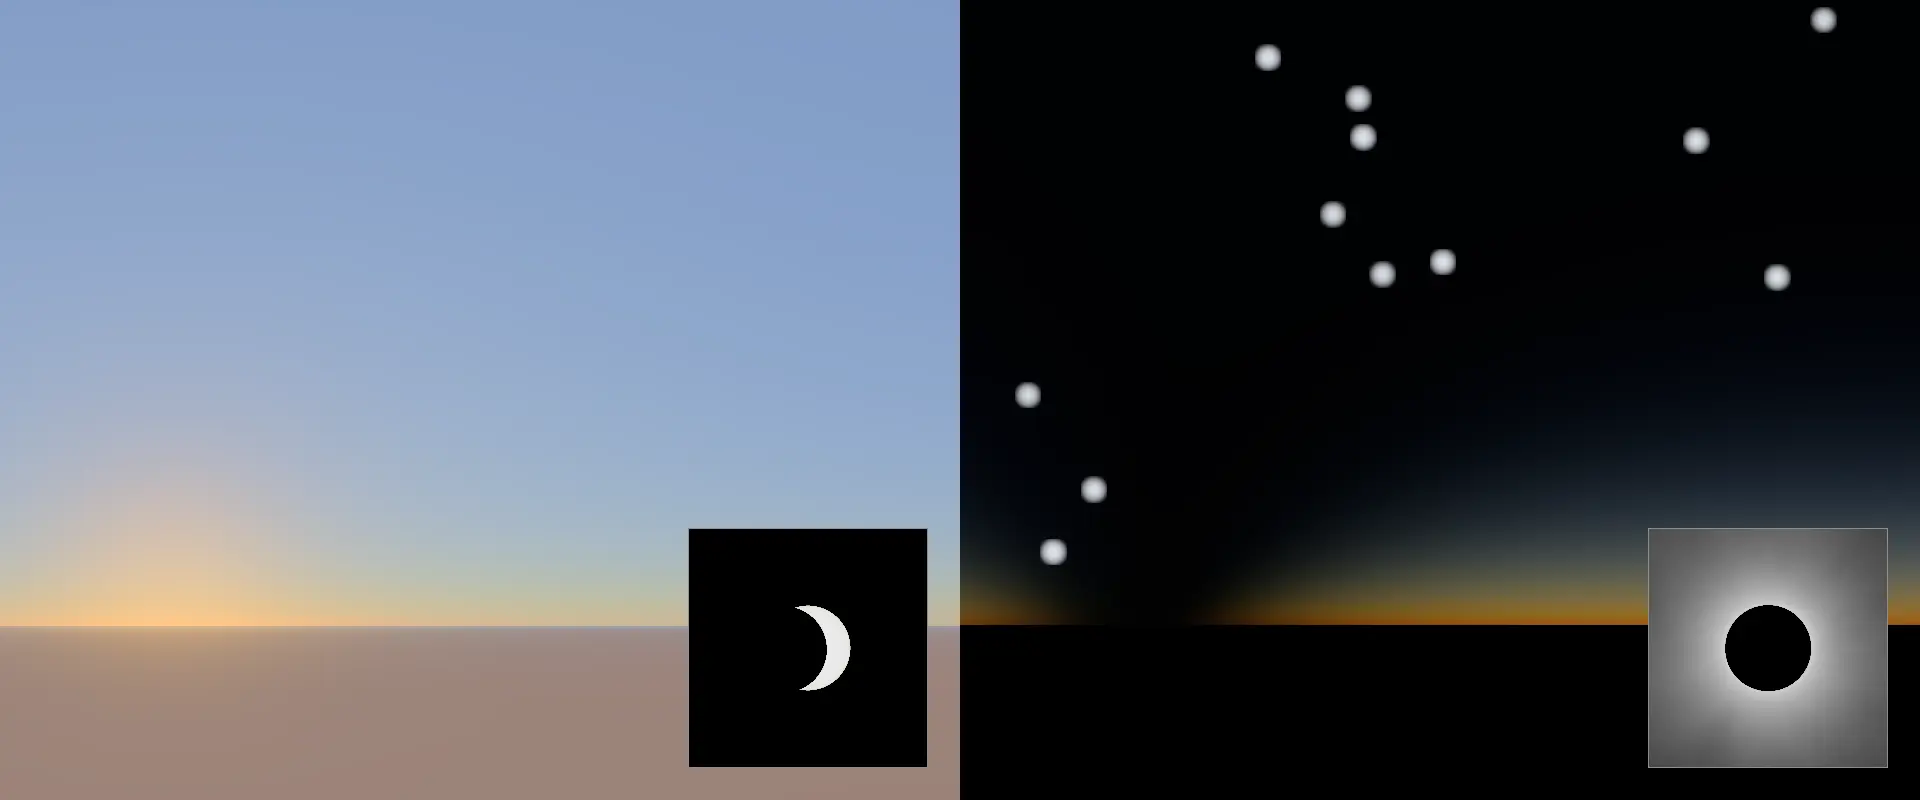
The path of totality crossed Iceland, the Atlantic and northern Spain; everywhere else in Europe the Moon took a bite out of the disc and no more. Three places are enough to cover the three ways of living through the same eclipse: a deep partial in Paris, a grazing totality in Palma, a high but short totality in Reykjavík. Everything is computed with skyfield on the JPL DE440s ephemeris, with nothing taken from an ephemeris website.
| Place | C1 first contact | C2 totality begins | C3 totality ends | C4 last contact | Magnitude | Obscuration | Sun's altitude at maximum |
|---|---|---|---|---|---|---|---|
| Paris Europe/Paris, UTC+2 | 17:22:15 UTC | no totality | 19:09:26 UTC | 0.931 | 92.12% | 7.71° | |
| Palma de Mallorca Europe/Madrid, UTC+2 | 17:38:05 UTC | 18:31:04 UTC | 18:32:43 UTC | 19:22:31 UTC | 1.013 | 100% | 2.64° |
| Reykjavík Atlantic/Reykjavik, UTC+0 | 16:47:14 UTC | 17:48:15 UTC | 17:49:21 UTC | 18:47:39 UTC | 1.002 | 100% | 24.52° |
Local time on top in each cell, universal time below; the table scrolls sideways if it does not fit the screen. Totality lasted 98.8 s in Palma de Mallorca and 65.8 s in Reykjavík. Magnitude is the fraction of the solar diameter covered, obscuration the fraction of the area: the two are never equal, and it is the second one that decides how much light is left.
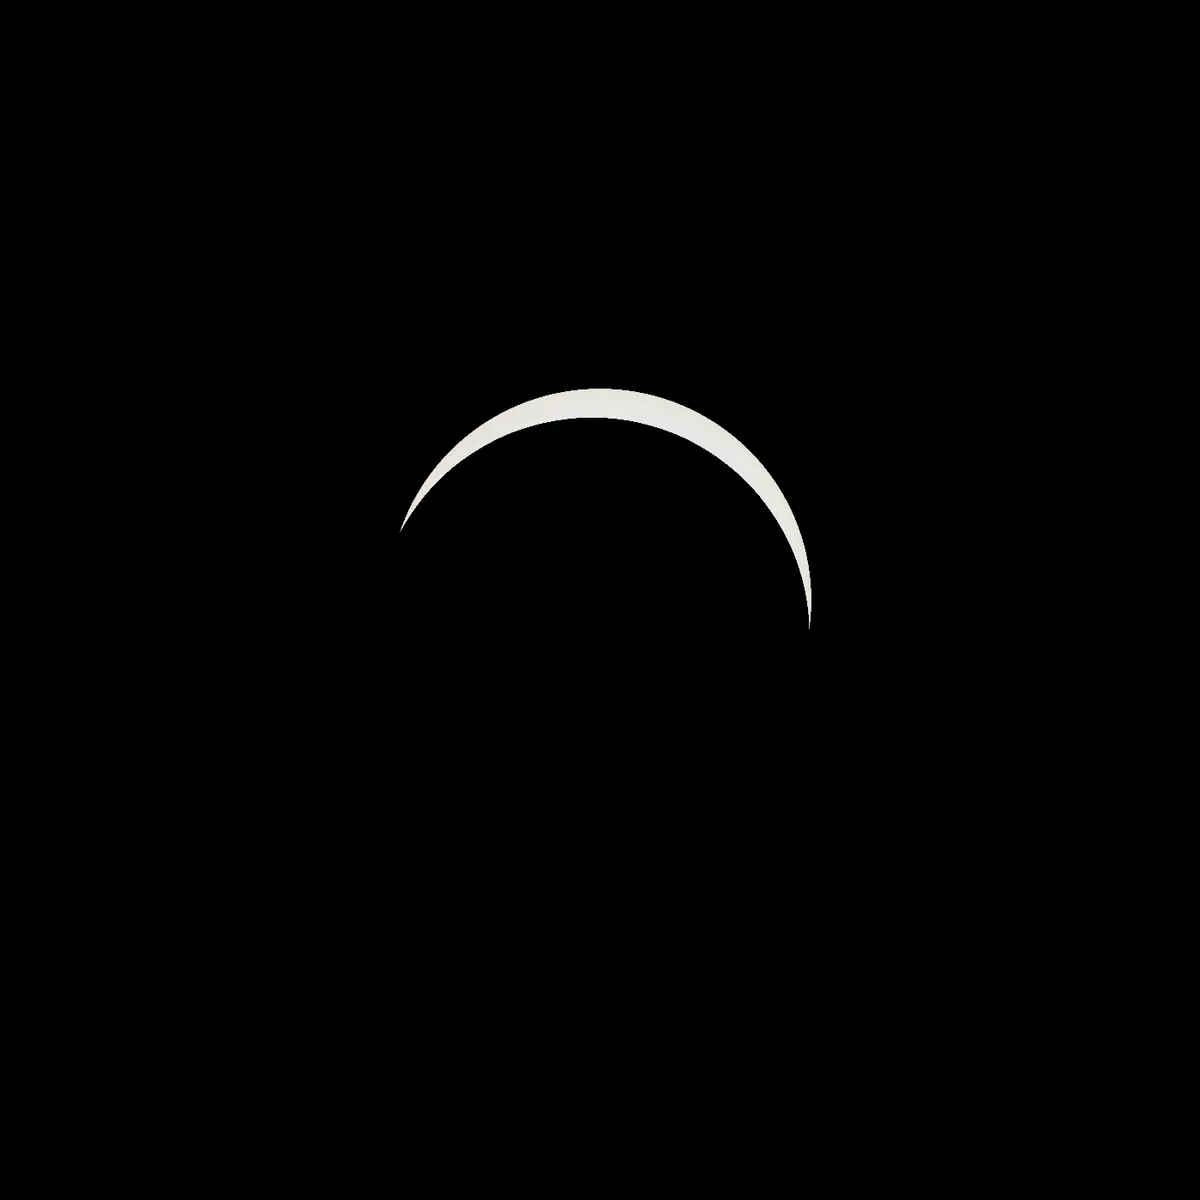
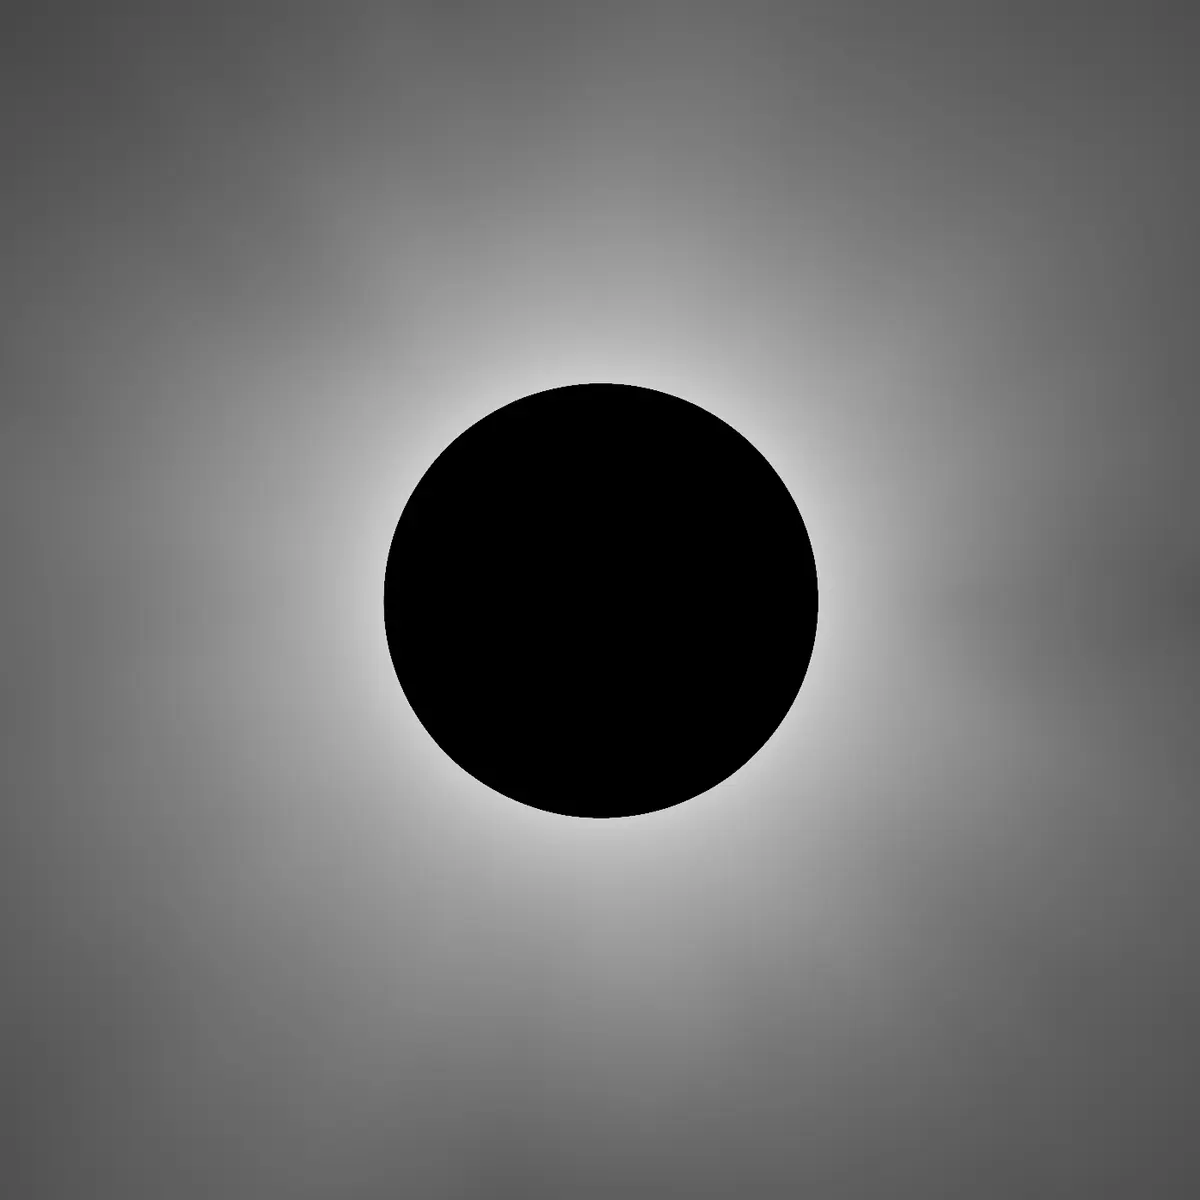
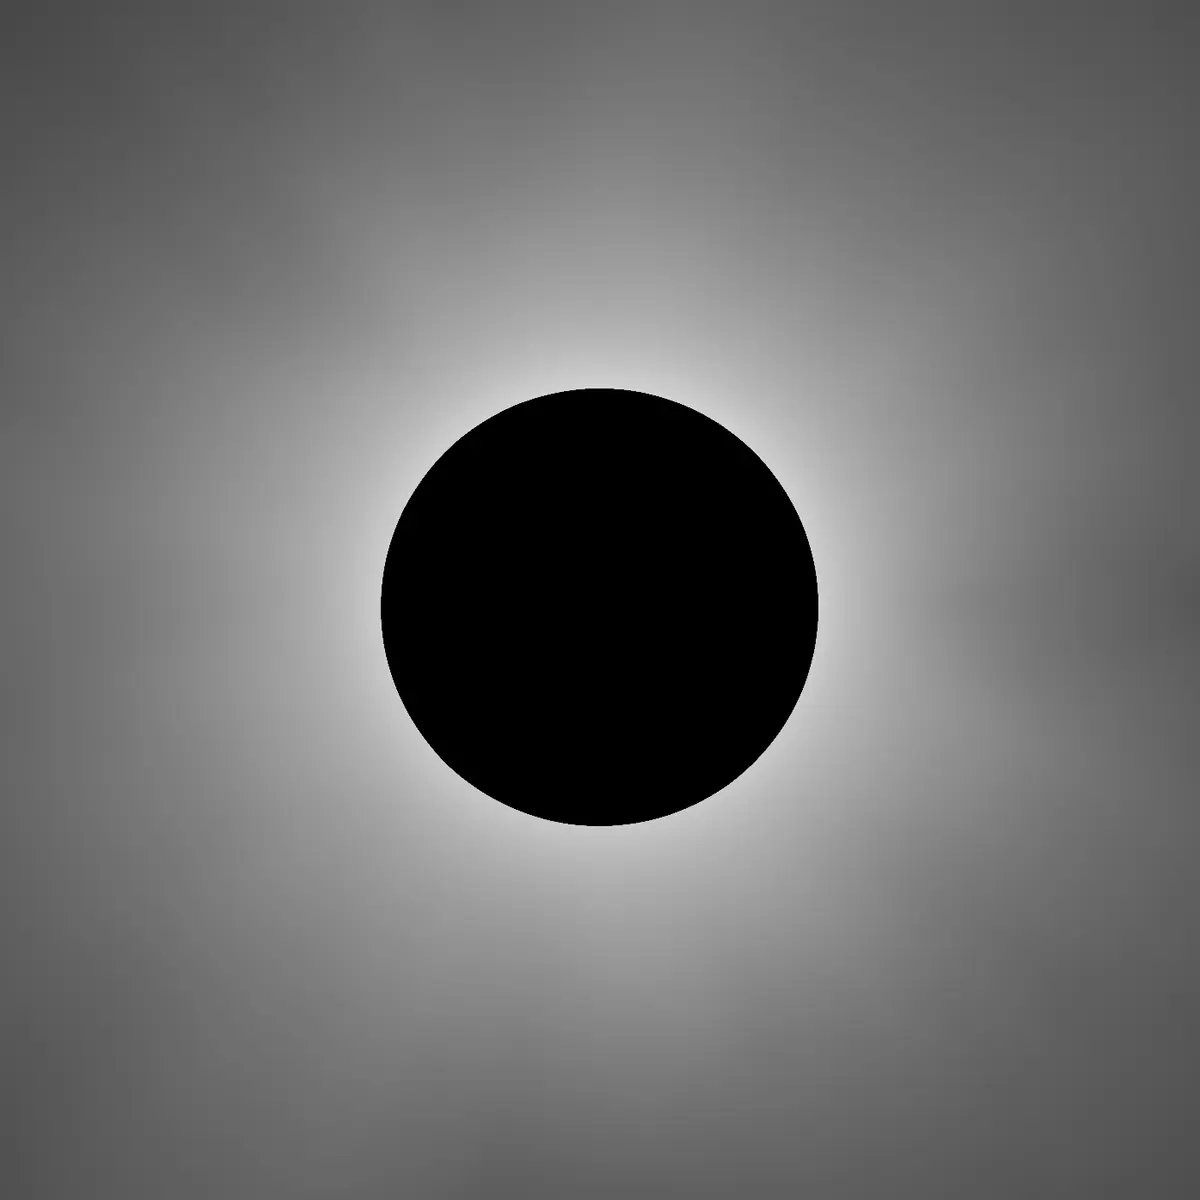
Telephoto view, 1.5° field, same scale for all three: the Sun fills a third of the frame. These images come out of the simulator's own inset shader, differing only in render size, and therefore from the same ephemerides as the table above. They apply no atmospheric extinction: in Palma, 2.64° up and under some twenty air masses, the real disc was deep red and the real corona far fainter. The corona follows the van de Hulst and Baumbach radial law with procedural streamers: it is plausible for a solar maximum, it is not the observed corona of 12 August.
In Palma, the eclipse ended below the horizon
Totality lasted 98.8 seconds there, at an altitude of 2.64°, about two fingers held up at arm's length. That is the Spanish signature of this eclipse: almost everywhere else you tilted your head back, here you had to look out to sea.
Fourth contact, for its part, falls at 21:22:31 local time, a good half hour after sunset. So the end of the eclipse was never visible from Palma: the Sun went down still bitten into, and the rest happened below the horizon. The table gives the instant anyway, because it is the relative position of two bodies, and that does not stop existing when the Earth gets in the way.
The Sun's limb is darker than its centre
The solar disc is not uniformly bright. Near the edge, the line of sight crosses a greater thickness of solar atmosphere and so comes to a stop higher up, in cooler layers: the limb radiates markedly less than the centre. A partial eclipse therefore does not remove light in proportion to the area it hides, and the gap changes sign along the way.
Early on, the Moon bites into the edge, which is the dark part. It takes away less light than area: at 10% obscuration, 91.4% of the flux is still there, not the 90% a uniform disc would give.
Deep in a partial, it works the other way round. The Moon covers the centre, the brightest part, and leaves only a crescent cut from the limb. At the Paris maximum, 92.12% of the disc was covered and only 5.4% of the light was left, where a uniform disc would have left 7.9%. Close to a third less than the naive answer.
The crossover between the two regimes falls around 33% obscuration, slightly before the lunar disc reaches the centre of the Sun. Before that point more light remains than the area suggests; after it, less.
the values behind both traces
| Obscuration | Real flux | Uniform disc | Difference |
|---|---|---|---|
| 0.0% | 100.00% | 100.00% | +0.00 pt |
| 9.9% | 91.44% | 90.05% | +1.39 pt |
| 20.0% | 81.09% | 79.96% | +1.13 pt |
| 30.1% | 70.22% | 69.90% | +0.32 pt |
| 39.9% | 59.35% | 60.05% | −0.70 pt |
| 49.9% | 48.31% | 50.08% | −1.77 pt |
| 60.1% | 37.19% | 39.94% | −2.75 pt |
| 70.0% | 26.59% | 30.00% | −3.41 pt |
| 79.9% | 16.56% | 20.12% | −3.56 pt |
| 90.1% | 7.12% | 9.89% | −2.76 pt |
| 100.0% | 0.00% | 0.00% | +0.00 pt |
Limb darkening is also stronger in the blue than in the red. At the Paris maximum 5.67% of the red flux was left against 5.00% of the blue: the little light that remained was a shade warmer than usual.
the values behind the curve
| Obscuration | Red flux | Blue flux | Red / blue |
|---|---|---|---|
| 0.0% | 100.000% | 100.000% | 1.0000 |
| 9.9% | 91.310% | 91.747% | 0.9952 |
| 20.0% | 80.977% | 81.361% | 0.9953 |
| 30.1% | 70.184% | 70.307% | 0.9982 |
| 39.9% | 59.420% | 59.198% | 1.0037 |
| 49.9% | 48.489% | 47.905% | 1.0122 |
| 60.1% | 37.462% | 36.565% | 1.0245 |
| 70.0% | 26.917% | 25.833% | 1.0419 |
| 79.9% | 16.900% | 15.820% | 1.0682 |
| 90.1% | 7.371% | 6.594% | 1.1178 |
| 100.0% | 0.000% | 0.000% | n/a |
And yet, in Paris, it was an ordinary evening
Nine tenths of the Sun gone, and most people noticed nothing. The temptation is to put that down to limb darkening; that would be explaining it with a mechanism pushing the other way, since we have just seen that it takes away more light still.
The reason is not in the sky, it is in the eye, whose response is roughly logarithmic. Dividing the flux by eighteen is not seeing eighteen times less: it is a little over four stops, about the gap between full sun and a heavily overcast sky. The pupil opens, adaptation follows, and the brain files the scene under a grey end of day.
the values behind both curves
| Obscuration | Real flux | Perceived lightness L* | Stops |
|---|---|---|---|
| 0.0% | 100.00% | 100.0% | 0.00 |
| 9.9% | 91.44% | 96.6% | -0.13 |
| 20.0% | 81.09% | 92.2% | -0.30 |
| 30.1% | 70.22% | 87.1% | -0.51 |
| 39.9% | 59.35% | 81.5% | -0.75 |
| 49.9% | 48.31% | 75.0% | -1.05 |
| 60.1% | 37.19% | 67.4% | -1.43 |
| 70.0% | 26.59% | 58.6% | -1.91 |
| 79.9% | 16.56% | 47.7% | -2.59 |
| 90.1% | 7.12% | 32.1% | -3.81 |
| 100.0% | 0.00% | 0.0% | −∞ |
Two mechanisms, then, pulling in opposite directions: the physics of the Sun removes more light than the geometry announces, the physiology of the eye lets far less of it show. Confusing the two is the common mistake; separating them is the whole point of computing rather than illustrating. Only totality escapes both, between C2 and C3: nothing is left of the disc, and no amount of adaptation makes up for zero.
Twenty seconds when the Sun was refracted and the Moon was not
One detail of the computation is worth telling, because it makes concrete what "computed properly" means.
skyfield applies atmospheric refraction body by body, and its model cuts off sharply below −1° of true altitude. The Sun crosses that threshold some twenty seconds before the Moon, which trails it by half a degree. For those twenty seconds one body was lifted by refraction and the other was not: the apparent separation of the two discs jumped by 0.55°, more than the sum of their radii. In Palma, where the eclipse carries on after sunset, that artefact landed in the middle of the partial phase. A picture would have shown a perfectly clear Sun, halfway through the eclipse.
The computation now lifts both bodies by the same angle, the one worked out for the Sun. Refraction then no longer changes the geometry, only the apparent altitude, which is what it is meant to do. A 0.44° step remains at the threshold crossing, but it affects both bodies together, and it happens below the horizon, where there is nothing left to see.
What is computed, what is modelled
A simulation without this list is only a picture. Now that the page draws, the line between computation and model falls in four places.
- Computed. The positions and apparent diameters of the Sun and the Moon, the four contact times, the magnitude, the obscuration, the Sun's altitude, and the stars and planets above the horizon. All of it comes from the JPL DE440s ephemeris read with skyfield, as topocentric apparent positions, standard atmospheric refraction included. One caveat about the stars and planets: they are worked out for the instant of greatest eclipse alone, not frame by frame. Over the hundred seconds of totality the sky turns by about 0.4°, roughly the size of the blob that stands in for a star on screen; running the timeline through does not visibly drift them, though it is not exact either.
- Modelled from physics. The Sun's limb darkening, through the quadratic law of Pierce & Slaughter (1977) taken at the wavelengths of the three sRGB primaries: that is what gives the residual flux per channel quoted above. Then Rayleigh scattering, Mie scattering and absorption by ozone, which together give the sky its luminance, and the geometry of the shadow cone, which sets how much of the Sun is still visible at every point of the atmosphere the ray crosses. One approximation in there is deliberate, and I would rather write it down: the multiple-scattering term is driven not by the flux at the point but by its average over ±50 km around it. Light that has bounced two or three times before reaching a spot under the shadow comes from a region a hundred kilometres across, much of which is still in full sun; driving that term with the flux at the point alone would dig a black hole where there is a ring of twilight.
- Modelled from perception rather than physics. Exactly one curve on this page falls here: the “perceived lightness” of the third figure, which is CIE L* lightness (1976). It is a standard model, but one defined at fixed adaptation, whereas an eye under an eclipse adapts as well; it therefore understates the very gap it is there to show. The other two figures contain nothing but the flux computation described above.
- Transformed for display. The exposure is fixed and the same in both panels, and the transfer curve is deliberately logarithmic: it models the four stops of eye adaptation discussed above. A literal rendering would have made Paris five times darker than an ordinary sky, which is what a camera on fixed settings records, not what anyone standing there saw. Nothing adapts to the content of the image: the same function everywhere, always. Auto-exposure would lift the dark panel and rub out precisely what the page has to show; here the contrast between Paris and Palma is preserved in perceived terms.
- Stylised, and said to be. The corona follows the van de Hulst and Baumbach radial law, with procedural streamers on top: a plausible corona for a solar maximum, not an observation of 12 August. Baily's beads come out of a lunar limb relief whose amplitude is real and whose profile is invented: the instant is true, the pattern is not. Planet brightnesses are assigned rather than computed; every star is the same colour; the horizon is a deliberately abstract plane, with no relief and no texture. And the telephoto inset applies no atmospheric extinction, nor do the three disc images at the top of the page, since they come out of the same shader: in Palma, 2.6° up and under some twenty air masses, the real disc was deep red and the real corona far fainter than they show. Their job is to let you check a geometry, not to redo the photometry the wide panel already handles.
The page still works without a line of JavaScript, and without WebGL 2: the simulator then steps aside for the fallback image it produced itself, and everything else stands. The three figures are hand-written SVG, so they inherit the light or dark theme instead of being frozen images; the three discs are static files; the tables folded under each figure need nothing more than a details tag.
Check rather than believe
An ephemeris computation is worth nothing until it is set against something other than itself. The four contacts, the magnitude, the obscuration, the altitude and the azimuth of the Sun were compared, for all three places, against published values recorded before the computation was run. The largest discrepancy on a contact time is 3.2 seconds. It falls on C3 at Reykjavík, where the published sources do not in fact agree with each other to better than ten seconds or so.
The report also says what it does not cover, and that part is the more useful one: Paris rests on a single source at the second level, and the exact point each city stands for is not published. Nobody has to take my word for any of it.
The validation report, on GitHub →
Every number on this page comes out of the same file, eclipse-2026-08-12.json: one frame every twenty seconds, from five minutes before C1 to five minutes after C4.